
News and Insights
.webp)
The K-Shaped Economy: Understanding Why Financial Outcomes Are Diverging
Over the past few years, there has been a growing disconnect between how the economy is described in headlines and how it is experienced in everyday life. On one hand, financial markets have performed well, consumer spending has remained resilient, and many indicators suggest
stability. On the other hand, a meaningful portion of households continue to feel pressure from rising costs and a limited ability to make financial progress.
This divergence is not accidental, and it is not temporary. It reflects a broader structural shift in the economy often described as a K-shaped economy, where different groups are moving in different financial directions at the same time.
A Simple Way to Understand the Divide
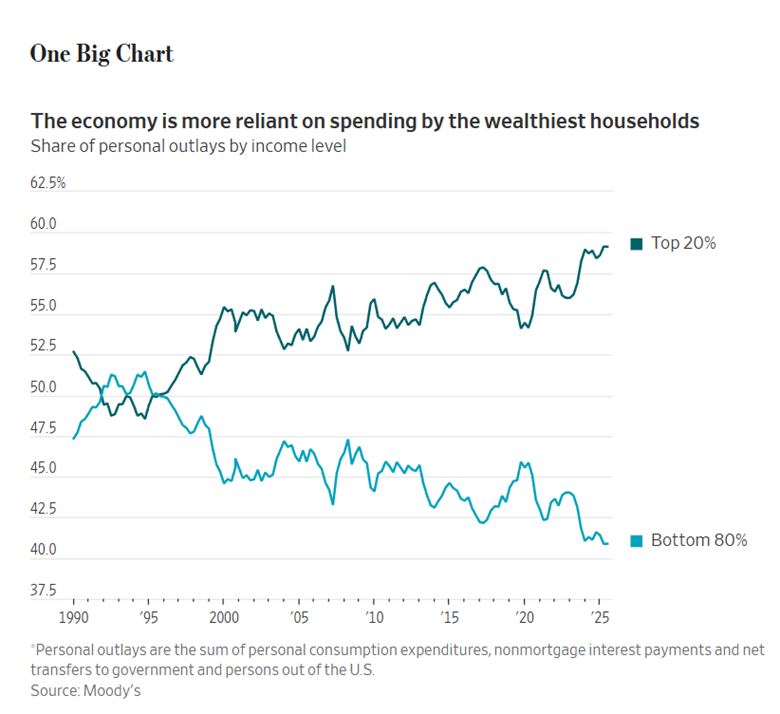
One of the clearest ways to see this divergence is through consumer spending patterns. Data from sources such as Moody’s Analytics shows that the top 20% of households now account for a growing share of total consumption in the United States, while the contribution from the bottom 80% has gradually declined over time.
This trend does not suggest that the majority of households have stopped spending, but rather that the overall economy has become increasingly dependent on a smaller segment of higher-income households to sustain growth. As a result, aggregate economic strength can coexist with financial strain across a large portion of the population.
The Wrong Metrics
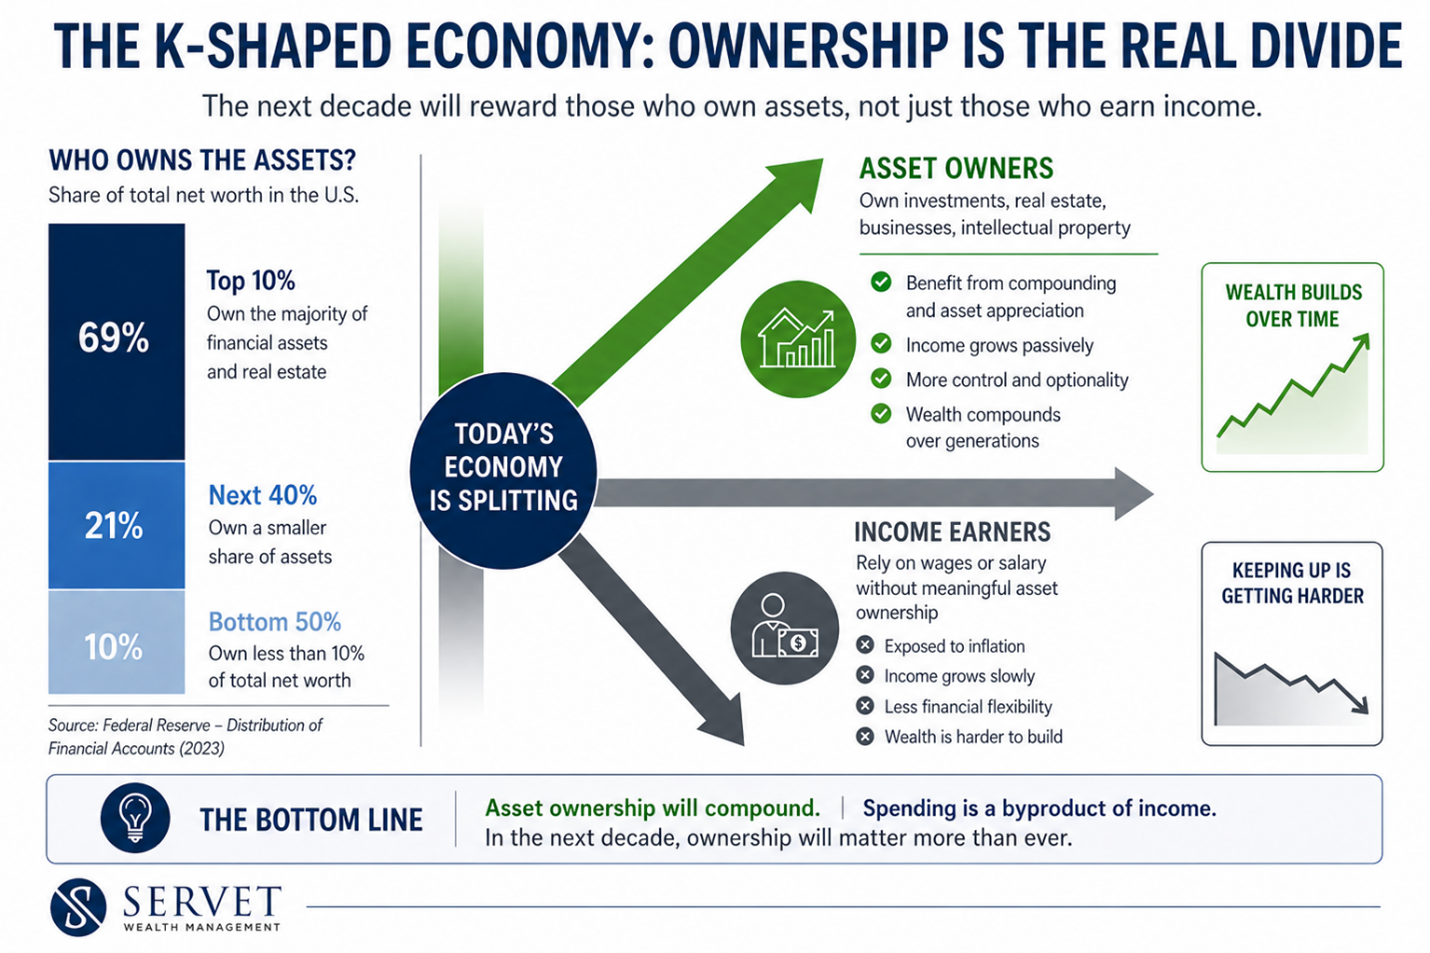
While there are several contributing factors to this divergence, the most consistent and measurable driver is the difference between households that own assets and those that primarily rely on earned income.
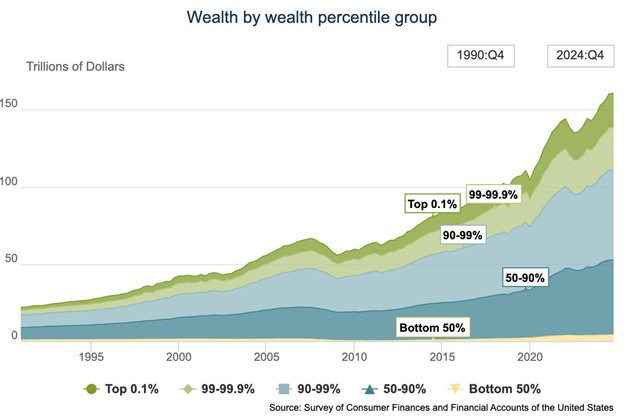
Data from the Federal Reserve’s Distributional Financial Accounts shows that the top 10% of households in the United States own a substantial majority of total wealth, while the bottom 50% collectively hold only a small fraction. This imbalance has persisted for decades, but its impact has become more pronounced in an environment where asset prices have appreciated significantly.
Over the last decade, equity markets and real estate values have grown at rates that exceed wage growth. As a result, households with exposure to these assets have experienced compounding
increases in net worth, while those without meaningful ownership have seen far more limited progress despite continued participation in the labor market.
Why Market Growth Does Not Translate Equally
It is often assumed that strong financial markets benefit the broader population. While this is true in a general sense, the distribution of those benefits is uneven. Higher-income households tend to own a disproportionate share of equities, either directly or through retirement accounts and other investment vehicles.
As a result, periods of market appreciation disproportionately increase the wealth of households that already have established portfolios. For households without meaningful exposure to these markets, the same period may not produce a noticeable improvement in relative financial position.
This helps explain why strong market performance does not always align with improvements in perceived financial well-being across the broader population.
Why Even The Upper Middle Class Feel Stuck
The reason many middle and upper-middle-class households feel stuck is not necessarily because they are worse off in absolute terms, but because progress today is measured more relatively than historically. Compared to 50 years ago, even top earners had less access to what is now considered standard, including frequent air travel, small daily luxuries, and the level of technology that exists in
a typical household today. The modern middle class travels more, has instant access to information and services, and benefits from conveniences that were once unavailable at any income level. By almost any objective measure, living standards have improved meaningfully over time.
However, financial satisfaction is rarely measured against the past. It is measured against the people around us. In practice, this creates a different experience. As an advisor, I regularly speak with households that have $2 million saved, take annual European vacations, and are objectively in a strong position, yet still feel behind. The reason is not their situation, but their reference point. They know someone who travels more frequently or spends at a higher level, and that comparison continues up the spectrum. What this illustrates is that while the middle class has made real progress, the gap to the next level has widened in a way that makes that progress harder to feel.
Looking Ahead: The Real K Shape
While much of the discussion around a K-shaped economy focuses on differences in spending, the more important divide is actually rooted in asset ownership. Spending can fluctuate with income and confidence, but ownership determines whether you participate in long-term growth.
Households that own equities, real estate, or businesses are positioned to benefit from compounding and rising asset values, while those who rely primarily on income are more exposed to inflation and slower wage growth. This distinction is likely to matter even more over the next decade, as economic gains continue to concentrate in scalable assets and capital-driven systems. In that sense, the K-shaped economy is less about who is spending today, and more about who owns the assets that will drive outcomes in the future.
If you found this article interesting, please consider subscribing to our blog or schedule a meeting with us to share your story. Book a meeting here.
Let's Meet!
.webp)
About the author: Nathan Lee is a CERTIFIED FINANCIAL PLANNER® and Behavioral Financial Advisor at Servet Wealth Management in New York City. He works with individuals and families navigating important financial decisions, including retirement planning, tax strategy, investing, income planning, and wealth management. Through his blog and YouTube channel, Nathan explains complex financial topics in a practical, easy-to-understand way.

I read every email and would love to hear if this blog helped you.
.png)
.png)

